Documentation
Profiler.
One CPU and memory profiler for every language server.
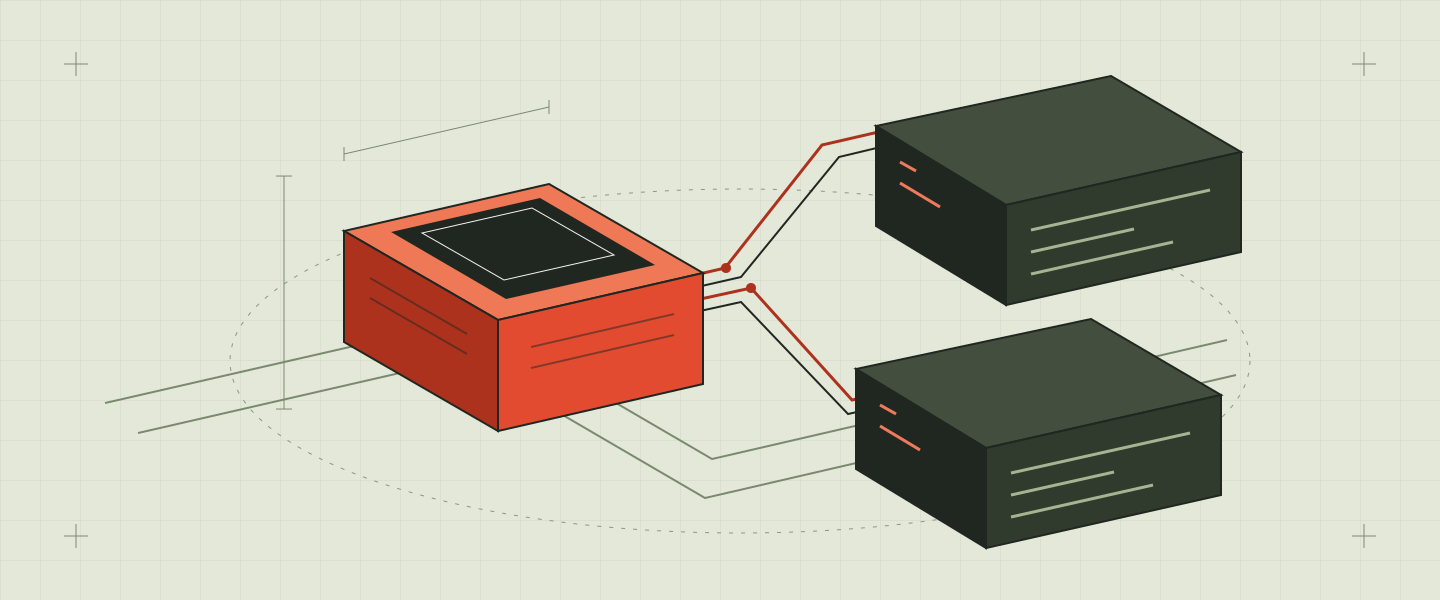
lsp-profiler profiles a running language server without leaving the editor. A language plugs in a runtime crate; sessions, reports and the protocol are shared.
What it measures
- CPU: sampling sessions, hotspots and flame graphs, exported as speedscope or V8 profiles.
- Memory: heap snapshots, retention paths and leak scoring.
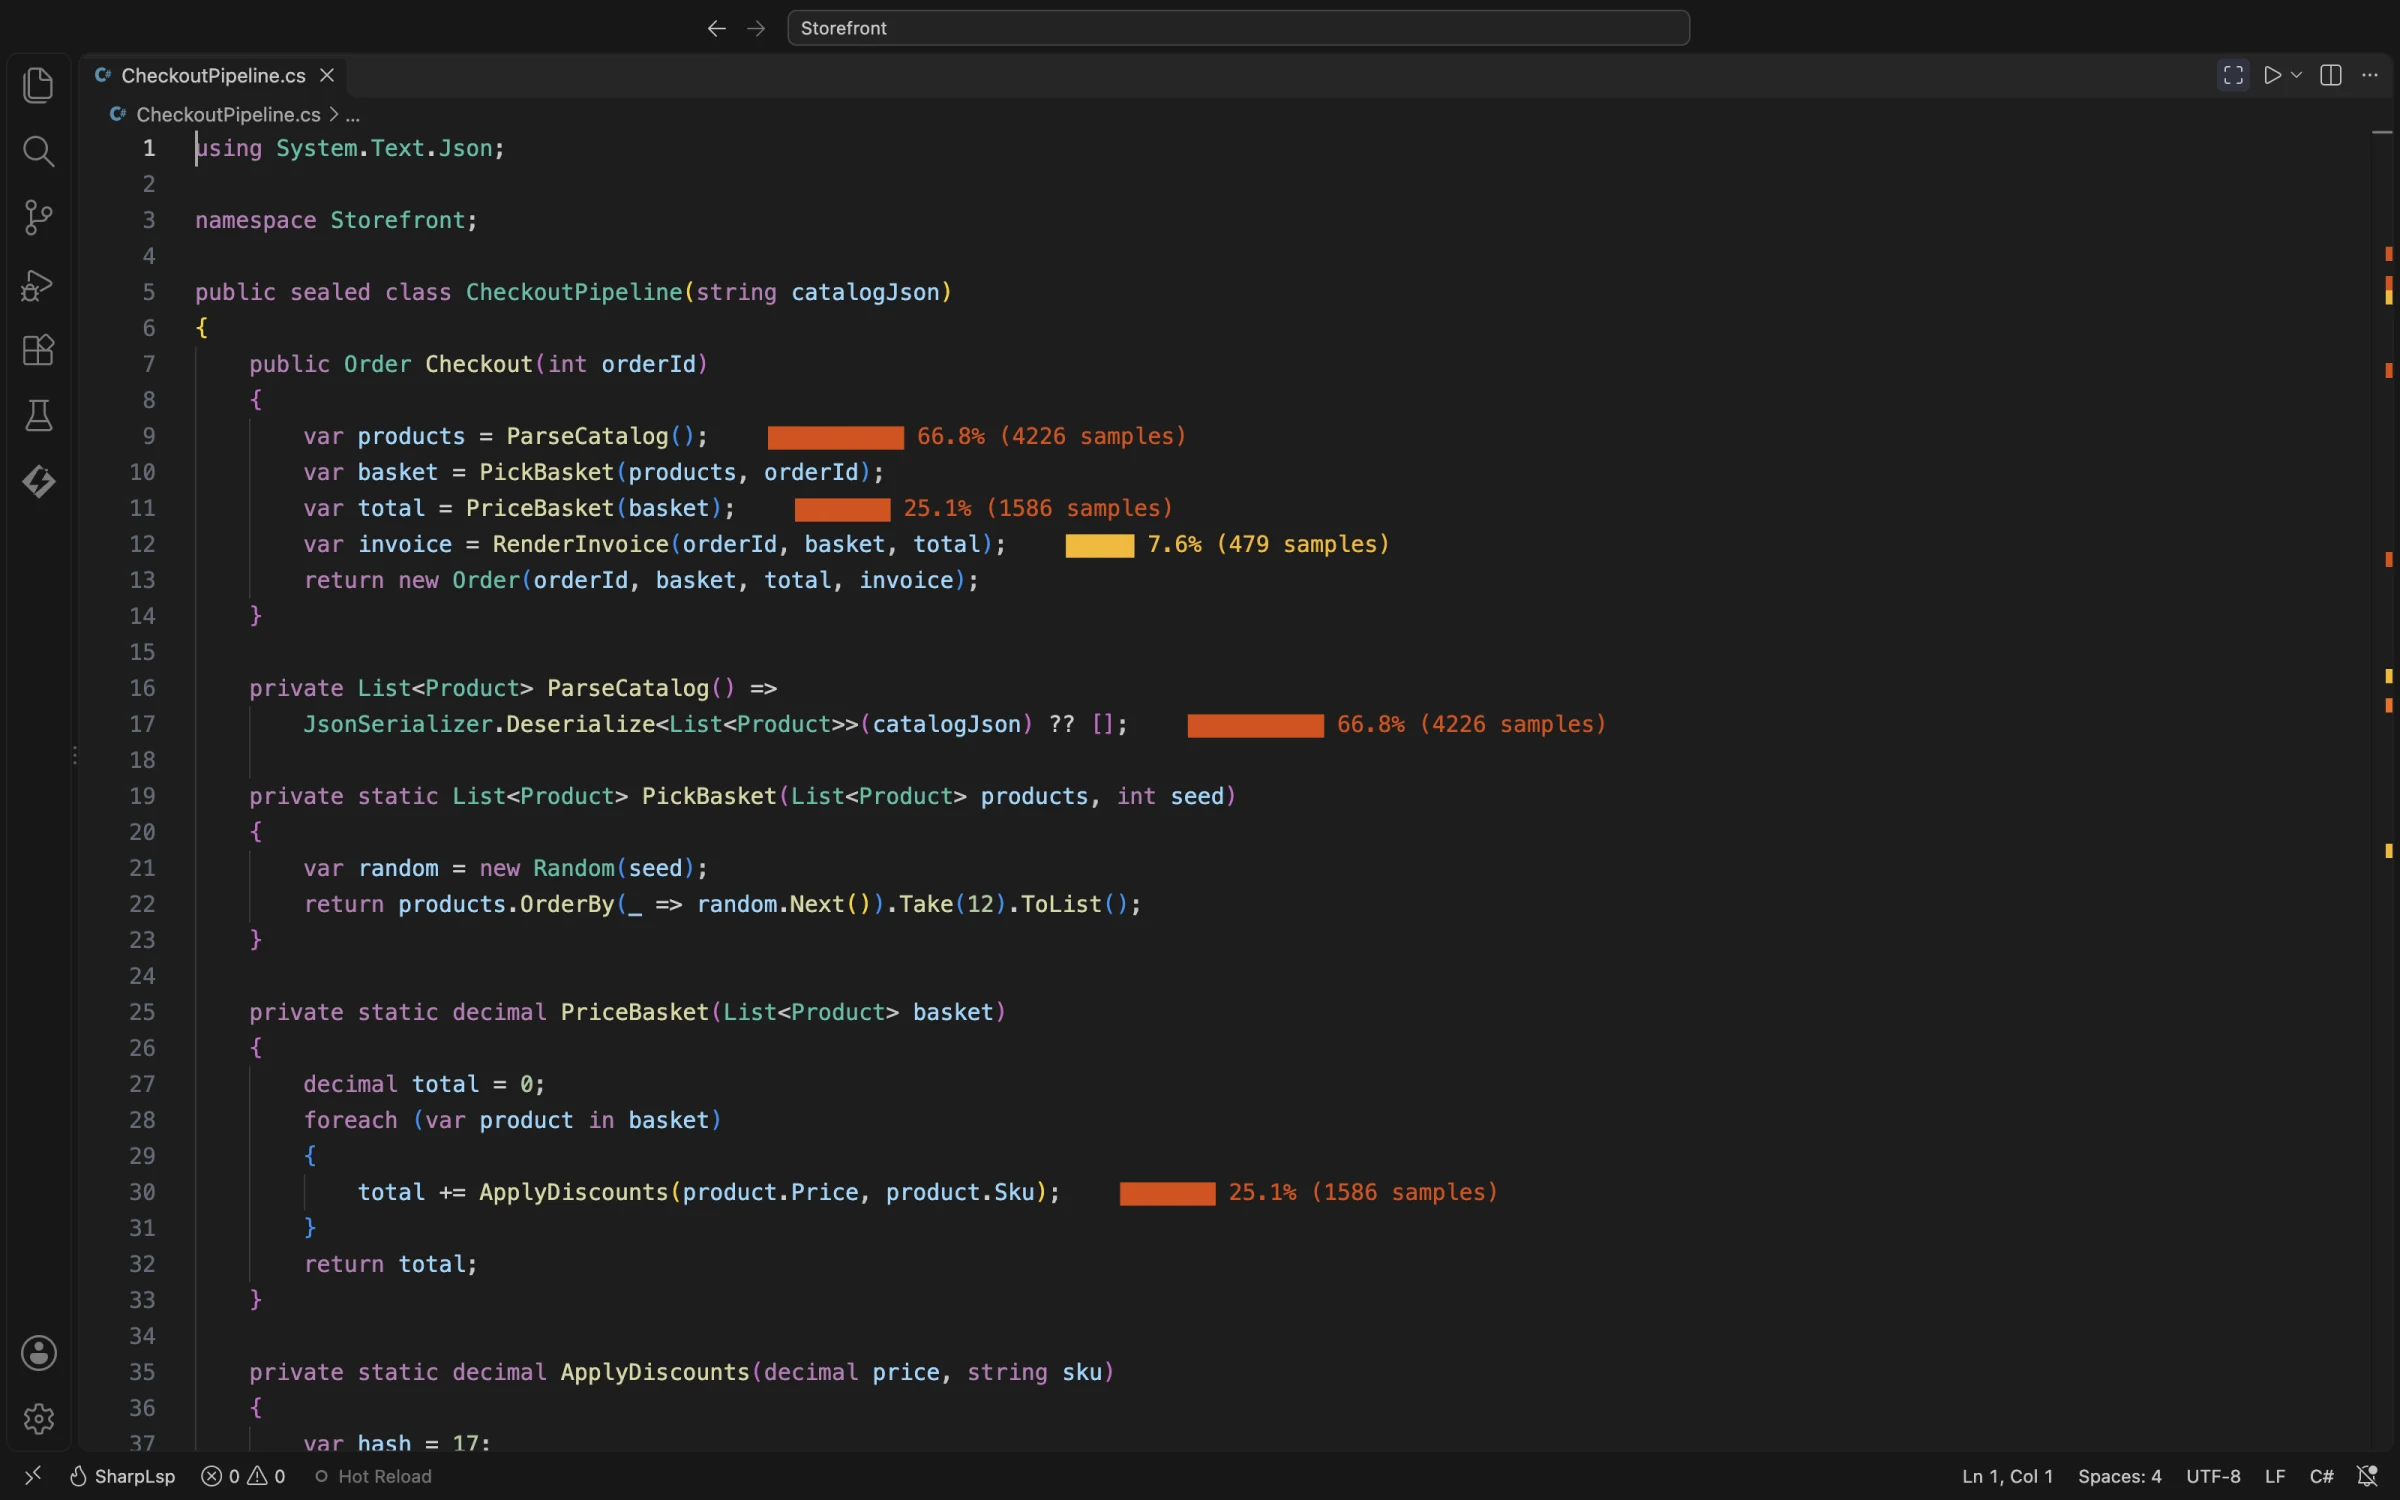
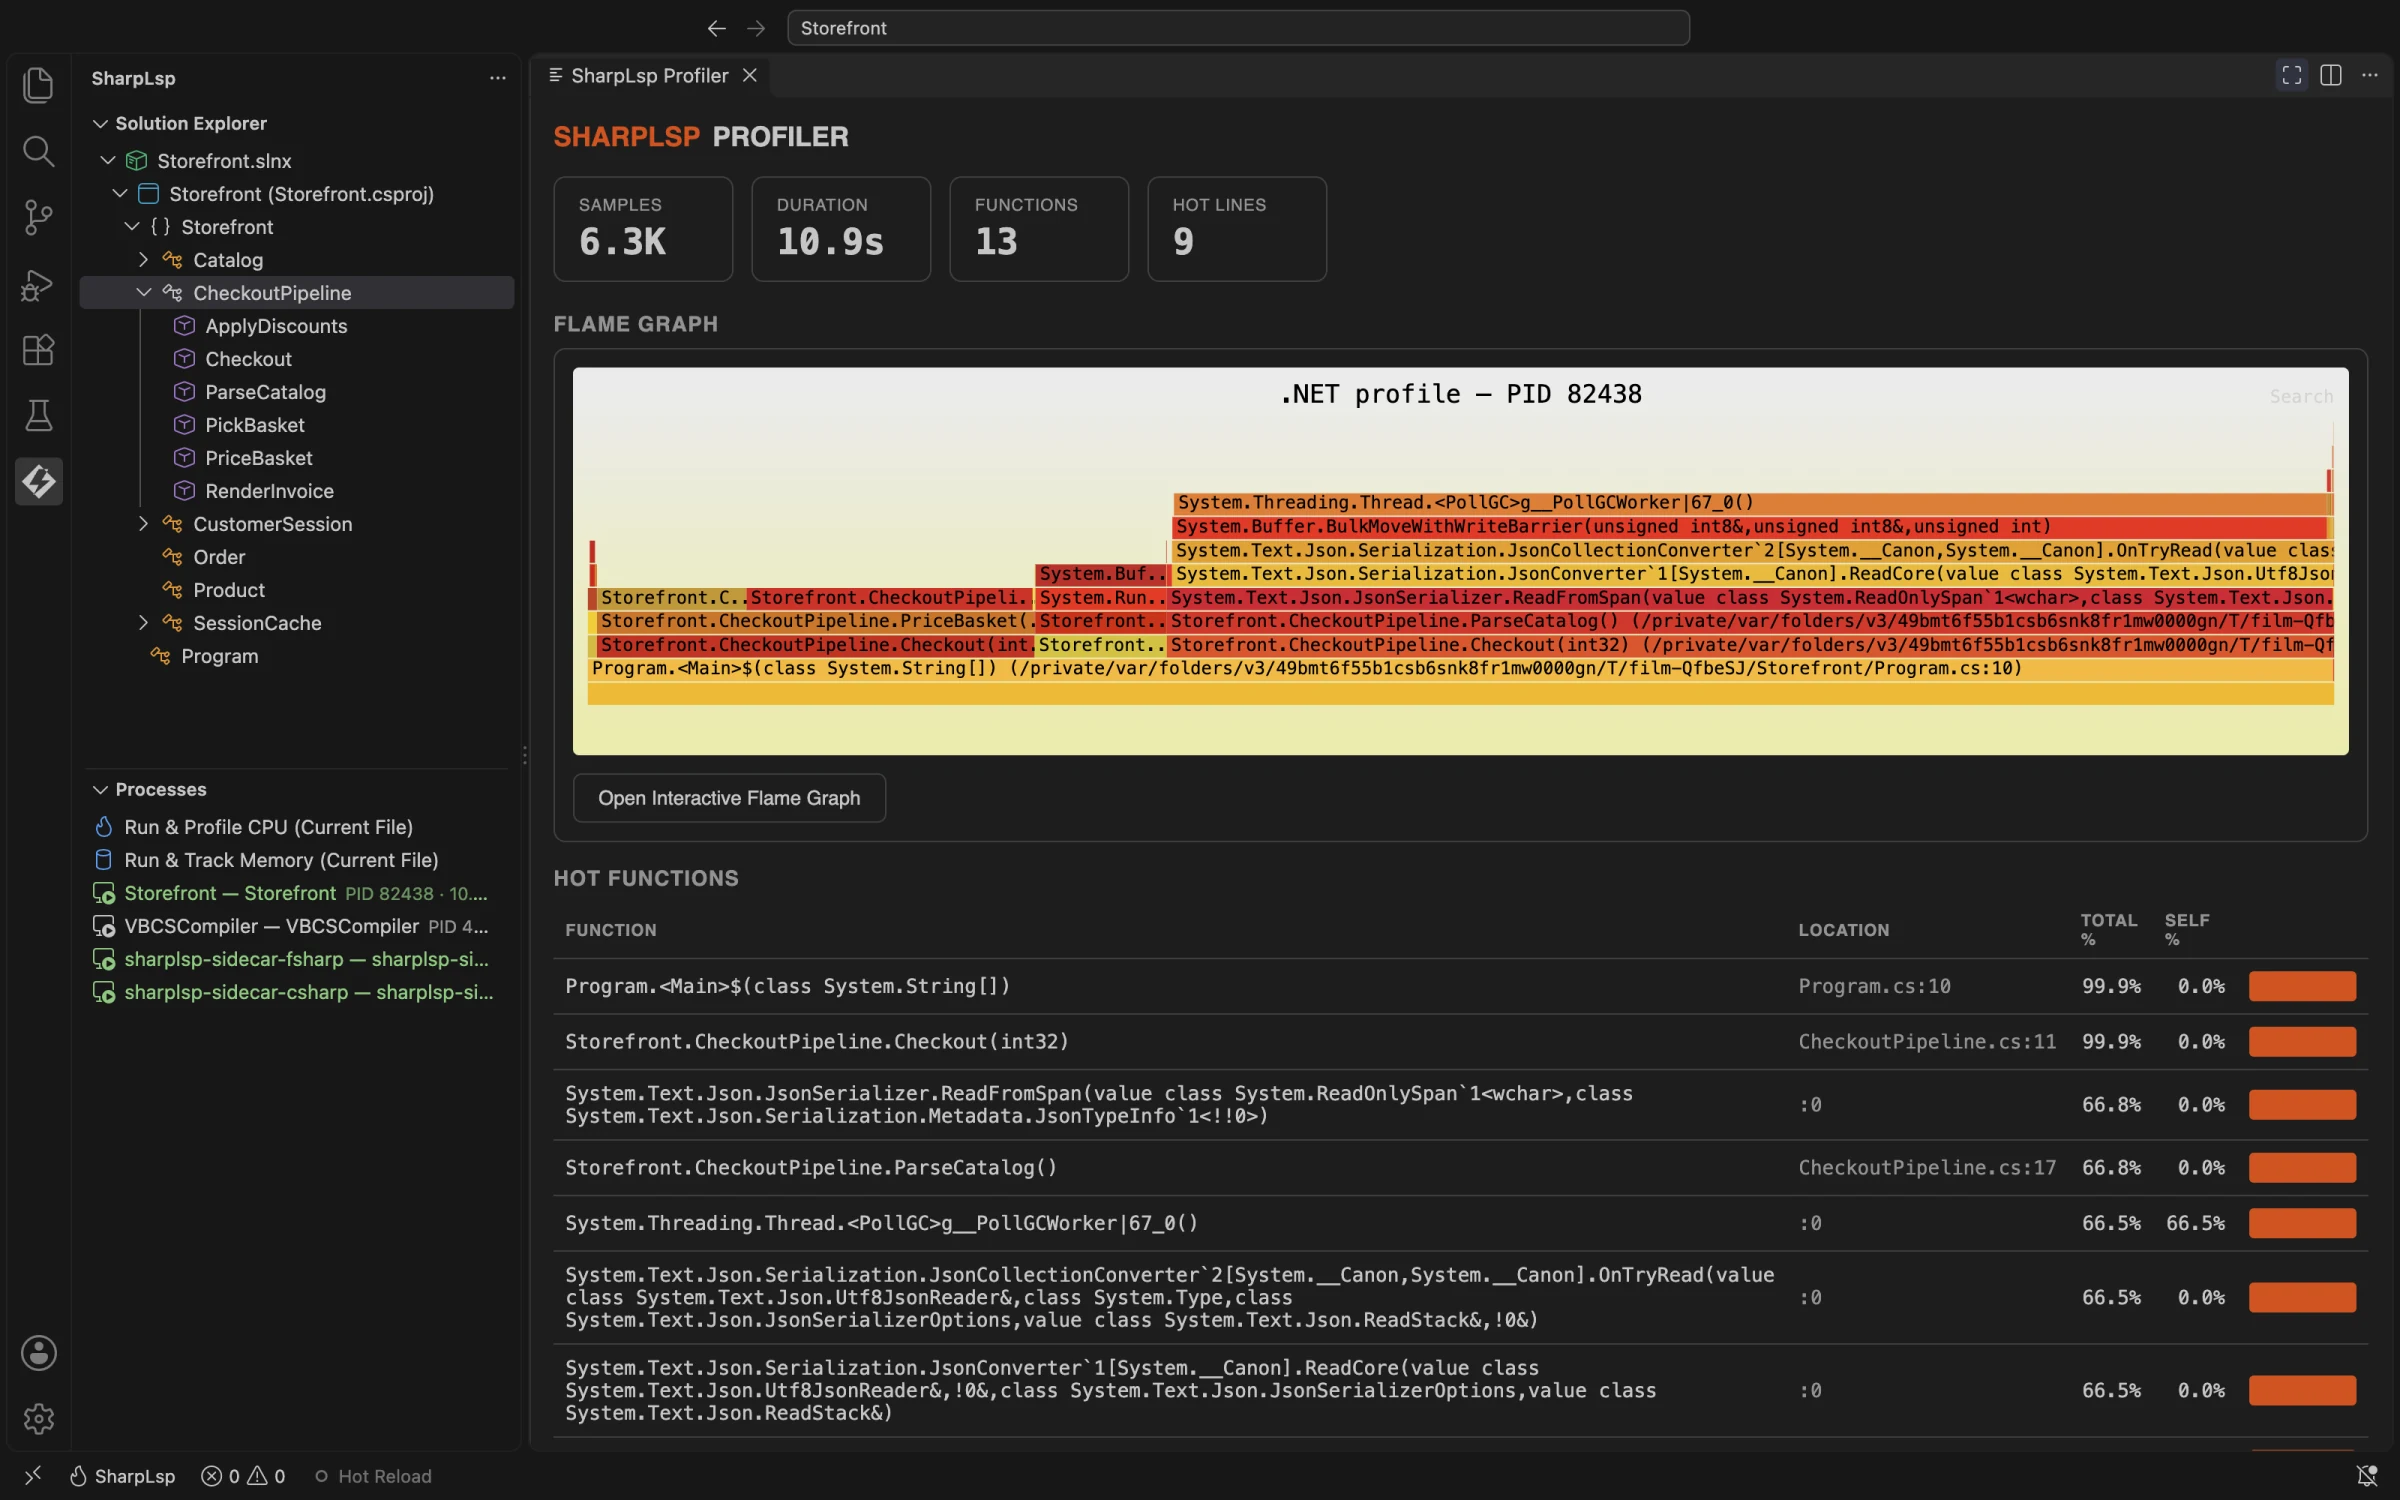
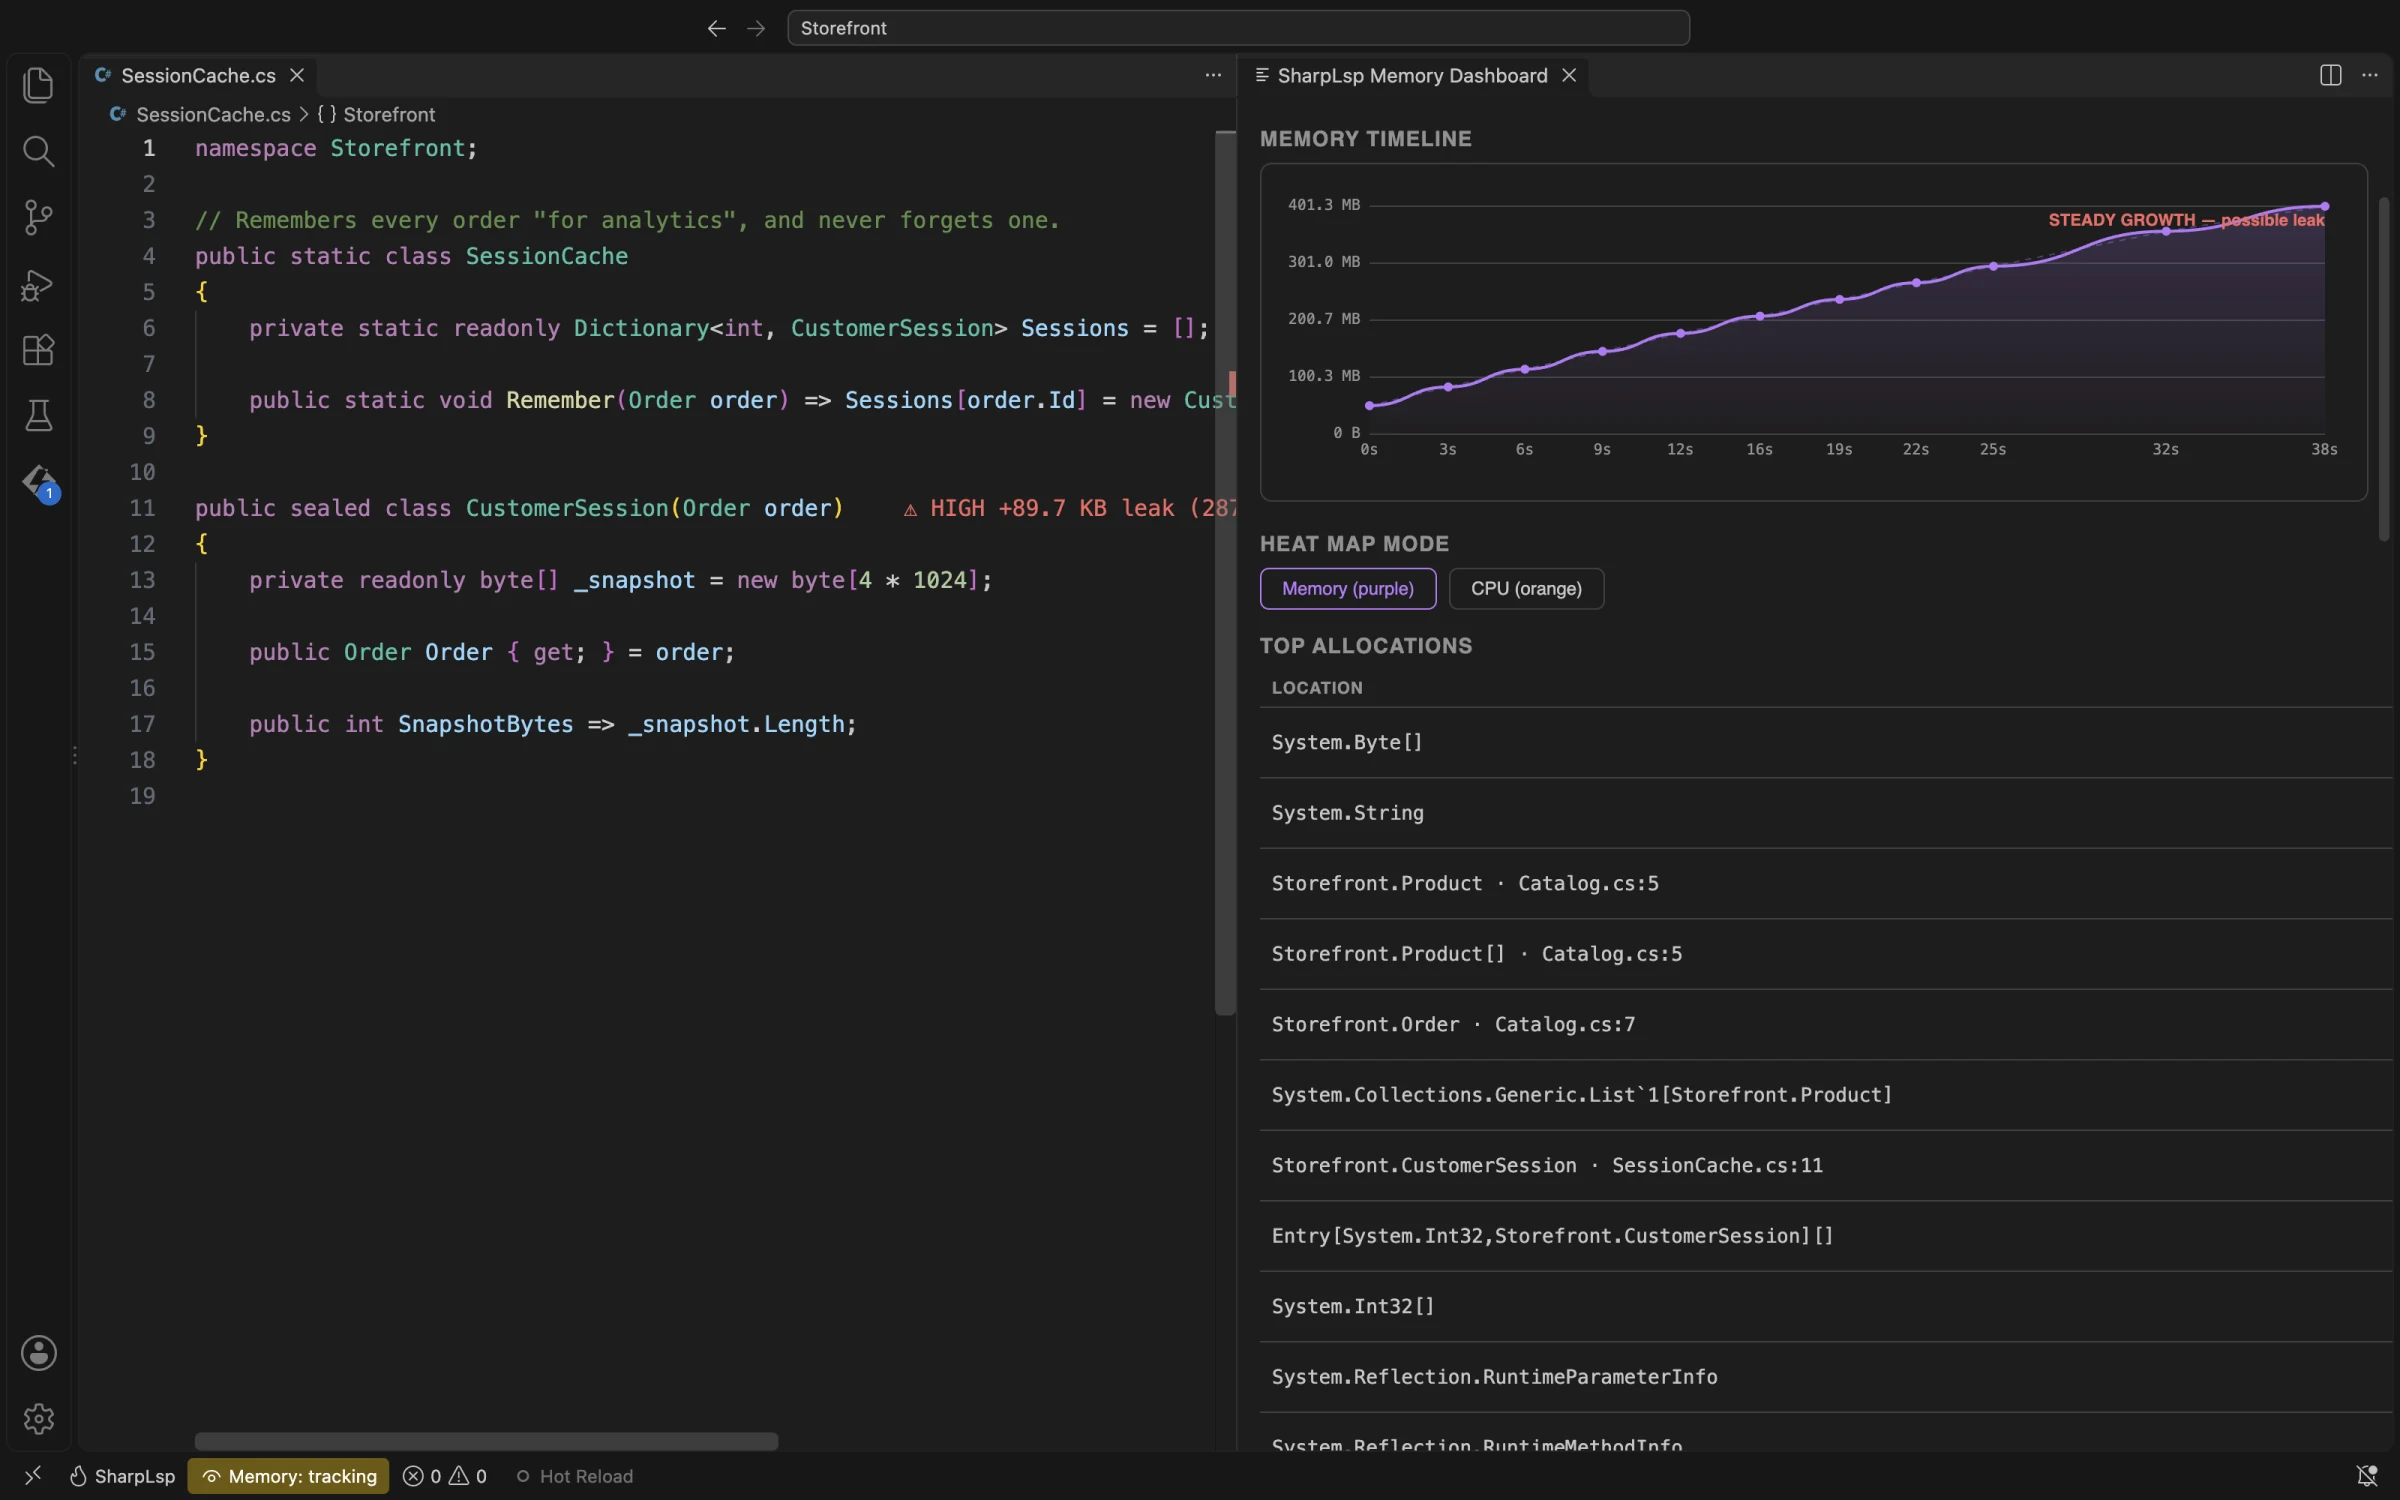
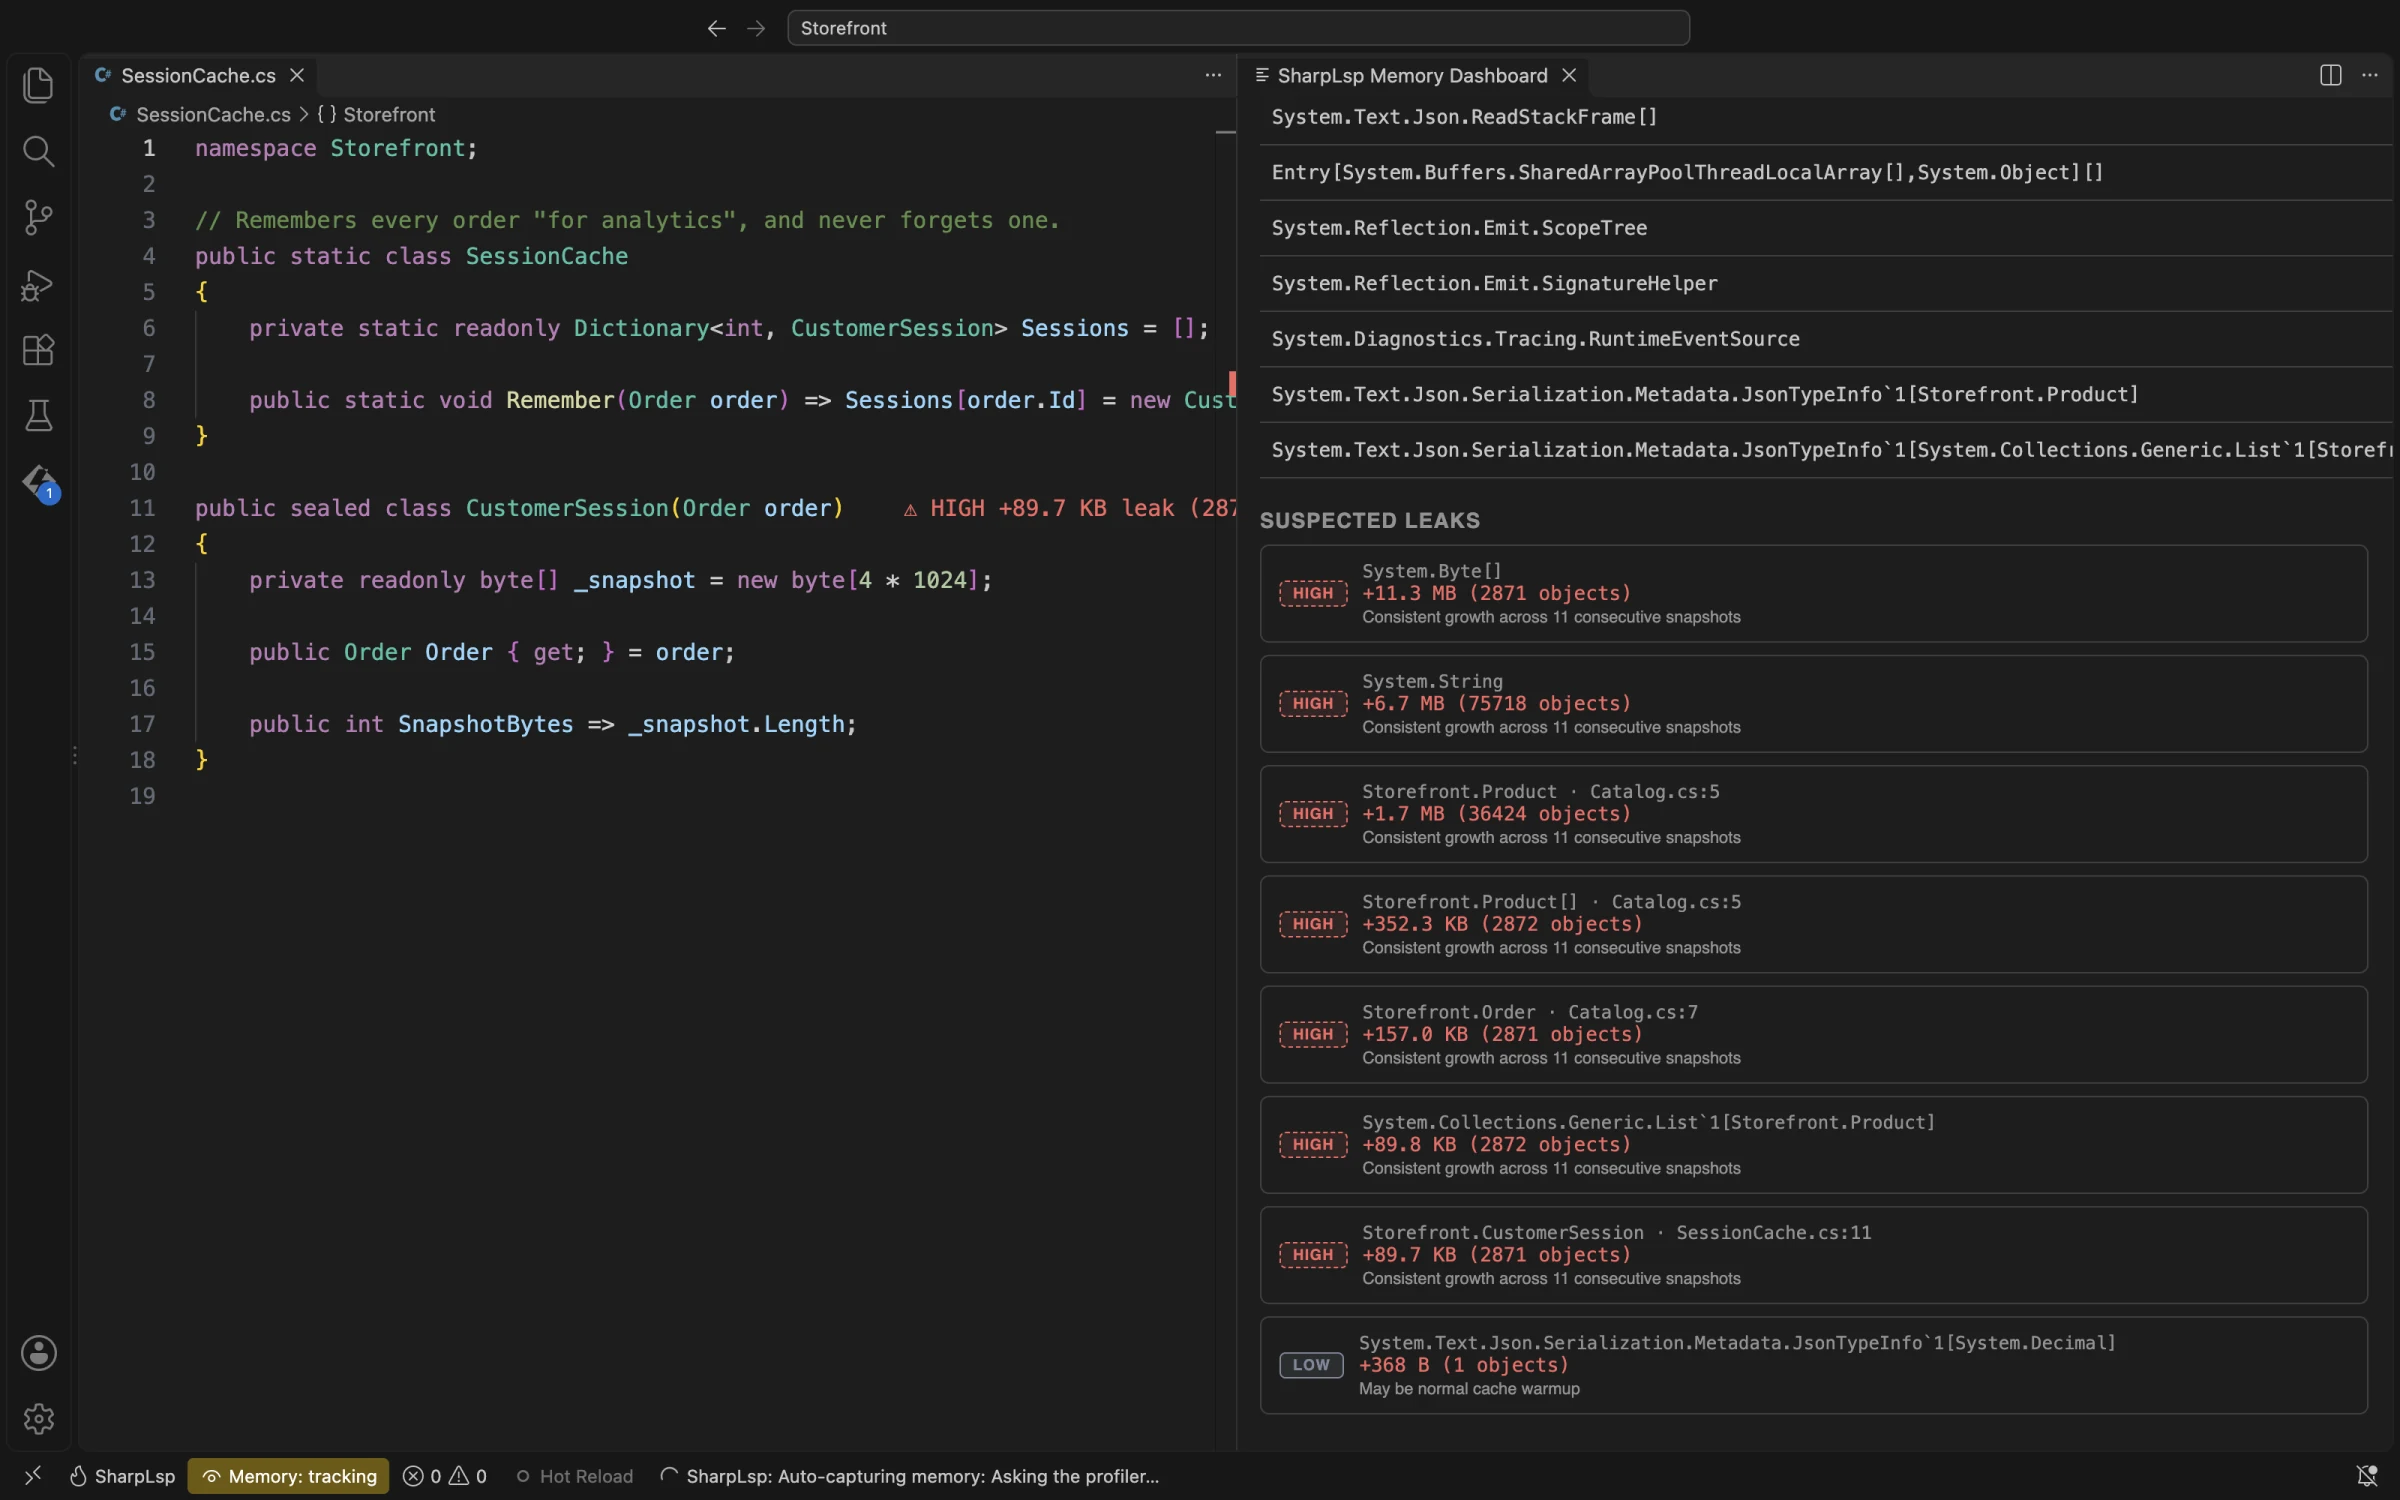

How it fits together
- Your server mounts
lsp-profilerand a runtime crate, such aslsp-profiler-dotnetfor .NET. - The editor talks to it over one JSON-RPC protocol.
@nimblesite/lsp-profiler-uirenders the results in VS Code.
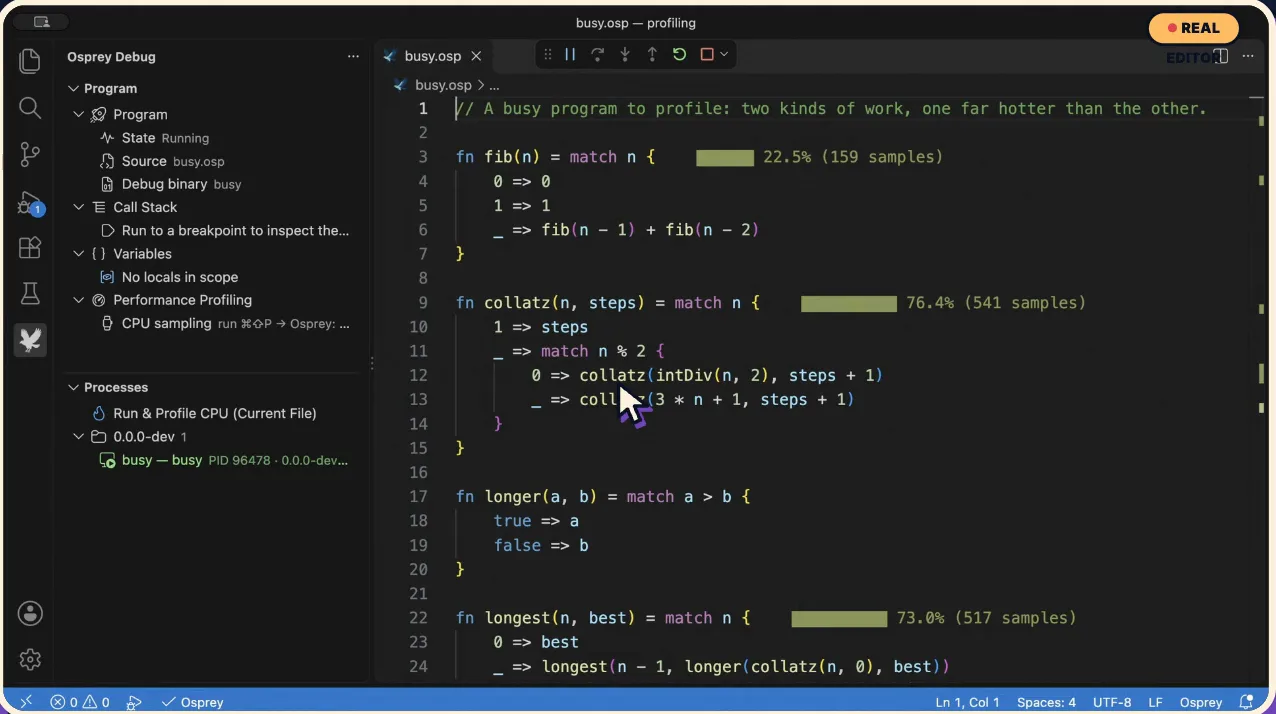
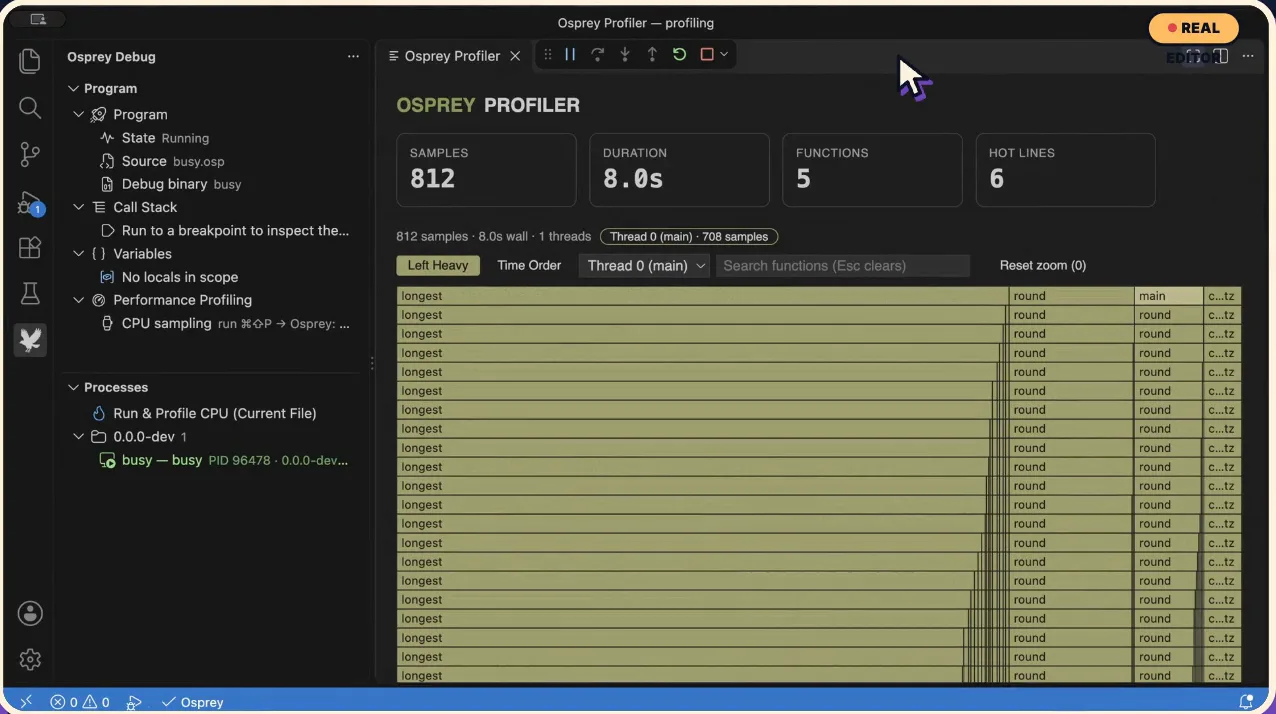
Add it
cargo add lsp-profiler
cargo add lsp-profiler-dotnet   # for .NET language servers
See it running in SharpLsp and Osprey. The full design is in the profiler spec.